Mean, Median, and Data Displays
Pilot statistics lesson with imported SVG gallery and ordering/numeric questions.
Two measures of center
The mean uses all values. The median is the middle value after ordering the data.
Two ways to display data
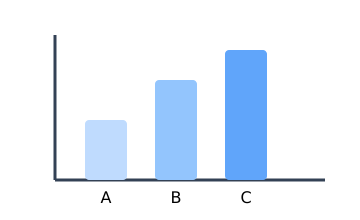
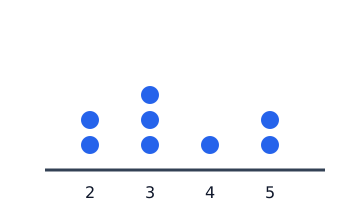
These SVG files are imported through the Media asset manifest and referenced by stable asset keys.
Example
Mean of 2, 4, 6
Add the values and divide by 3.
\frac{2+4+6}{3}=4
Order data before finding the median
The median is based on position, so the values must be sorted first.